
Illustrated Guide for Researching Your Community

Photo credit: Boston Heath via Lightstock
by Rudy Mitchell, Senior Researcher
Click here for a template of a community research guide.
Community or Neighborhood Name:
Community geography
Clearly identify the boundaries of your community (geographical, political).
Identify the U.S. Census tracts of the community (unless you are covering a large area) or identify other defined areas used in population or demographic surveys.
Describe the main geographical features of the neighborhood or community. Describe any other basic defining characteristics or features. What key features (rivers, hills, waterfront, railroad, etc.) influence or define the nature and boundaries of the community?
Create or obtain a detailed map of the neighborhood or community. Add boundaries and use the base map to add other items of interest such as churches, schools, social service organizations, landmarks, cultural organizations, neighborhood associations, recreational facilities, and other resource assets. Separate maps can be created for different types of resources or institutions. You can also do this using layers in digital maps. You can use Google My Maps to create and share online maps. See google.com/mymaps. Another online option is to create a map in Harvard World Map, worldmap.harvard.edu, or Open Street Map, openstreetmap.org.

Grove Hall Boundaries and Census Tracts

Map of neighborhood churches
Examples of maps in a community study.


Map of Organizations and Programs in a Neighborhood

Key to map
Maps of schools, churches, and other institutions can be created, or these can be combined using symbols into one map.

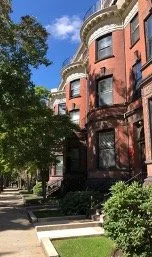
Hawthorne Grove, the Marshall P. Wilder Estate
Community history
Research the community’s history using primary and secondary sources, as well as oral history interviews. Aspects of community history may include biographical information on significant people; the history of the built environment; the history of religious and cultural organizations; economic and political history; and the history of ethnic, racial, and social changes. The history can be presented in narrative form supplemented with maps, charts, and visual illustrations.

Old Blake House, Edward Everett Square, Dorchester
Overall population and population trends
What is the current total population of the community or neighborhood?
What overall population trends have occurred in the last several decades? Include earlier data if available. Explore possible reasons related to the changes and possible future trends.
| Decade | 1990 | 2000 | 2010 | Latest |
|---|---|---|---|---|
| Total population | ||||
| % change from previous decade |
[The formula for the % change is (B-A) /A x 100. Say the 1980 population (A) is 1,000 and the 1990 population (B) is 800. To find the percentage change from 1980 (A) to 1990 (B), begin on the calculator with B (800) and subtract A (1,000), then divide that by A (1,000) and multiply it by 100. You should get -20. You can add the percentage sign (%) to -20. The percentage change from A (1,000) to B (800) is -20%.]

Example of a line graph showing the population trend for a neighborhood study.
Ethnic and racial composition and trends of the community
Fill out this table for the major ethnic and racial groups in the community. (You may expand the table if you would like to include more groups, or you may combine smaller groups into an “Other” category.) Separate tables can be created for each census tract or for specific nationalities within the Hispanic group. Graphs and maps may also be used to visualize trends and changes. If the community has other nationalities and ethnic groups not listed in your table, you can list and describe them separately. Describe any intercultural or inter-racial tensions that exist. Summarize your observations and analysis of population trends.
| Name of group (ethnic group, racial group etc.) | 2000 | 2010 | Latest | pop. of group | % of total pop. | pop. of group | % of total pop. | pop. of group | % of total pop. |
|---|---|---|---|---|---|---|
| 1. | ||||||
| 2. | ||||||
| 3. | ||||||
| 4. | ||||||
| 5. | ||||||
| Total pop. | 100% | 100% | 100% | |||
The formula to find the percent is A/total x 100. Say 2,000 people (total) are in your community, and 250 (A) are Hispanic. Put 250 (A) on your calculator, divide by 2,000 (total), and multiply by 100. You should get 12.5. You can add the percent sign to your answer because you multiplied by 100. 250/2,000 x 100 = 12.5% of the people in your community are Hispanic. (Make sure your percentages total 100%.)
From this table, how has the ethnic and racial composition of the community changed in the last few decades? Summarize your observations and analysis of population trends.
Describe any intercultural or inter-racial tensions that exist.
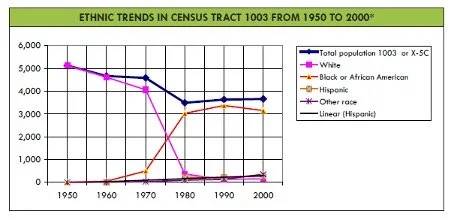
Example of a graph showing racial trends in a neighborhood.
Languages spoken and linguistic isolation
What languages are spoken in the community? Provide numbers per language.
What number and percentage of the population are linguistically isolated? ( A household is linguistically isolated if all members 14 years and older speak a non-English language and they speak English less than “very well.”) Of those who are linguistically isolated, what percentages speak various languages other than English? What percentage of the population over 5 years speaks English less than “very well?”

What are the age characteristics of the community’s population?
Complete the following table to reveal any important differences between the age profile of the church, community, and nation. Use your personal estimate or ask your pastor for the church data. (Figure the percentages and make sure they add up to 100.) Do the percentages differ significantly between the church, the community, and the nation?
| Age category | Your church | Community | Nation | Number | % | Number | % | Number | % |
|---|---|---|---|---|---|---|
| 0-4 years | ||||||
| 5-9 years | ||||||
| 10-19 years | ||||||
| 20-34 years | ||||||
| 35-64 years | ||||||
| 65+ years | ||||||
| Total | 100% | 100% | 100% | |||
The formula to find the percent is A/total x 100. Say there are 200 people (total) in your church, and 25 (A) are youth. Put 25 (A) on your calculator, divide by 200 (total), and multiply by 100. You should get 12.5. You can add the percent sign to your answer because you multiplied by 100. 25/200 x 100 = 12.5% of your church are youth.
What is the current median age of the population? Compare this with the median age of the nation, state, and larger city, or metropolitan area. Compare median age differences between different races in the community (and between the Hispanic and non-Hispanic populations).
Observe more specific characteristics of the teenage and young adult populations, such as the racial and ethnic composition. Break down the age groups by single years.
Which generations are represented in significant numbers in your church? Is one generation dominant?
Baby Boomers, born 1946-1964
Generation X, born 1965-1980
Millennials, born 1981-1996
Generation Z, born 1997-2012


Examples of graphs showing age profiles and comparisons of a neighborhood.
Family Characteristics and Marital Status
What is the average household size in the community? What is the average household size in the individual census tracts or subsections of the community? Observe any variations and also compare with the metropolitan area, state, and nation.
What are the numbers and percentages of the population (over 15 years) in your community who are:
| Marital status | Number | % |
|---|---|---|
| Now married (except separated) | ||
| Single (never married) | ||
| Separated | ||
| Divorced | ||
| Widowed | ||
| Total population (over 15 years) | 100% |
Source:
What percentage of families consist of (Compare to total population: A/total x 100 = %)
Married couples with children (under 18 years)? %
Married couples without children (under 18 years)? %
Households
What is the total number of households?
What percentage of households are family households?
What percentage of households are non-family households?
How do these percentages compare with the state and national percentages?
How many family households have children under 18 years?
How many of these family households with children under 18 are female-headed with no male spouse present?
How many of these family households with children under 18 are male-headed with no female spouse present?
What number and percentage of family households with children under 18 are single-parent households?
Number:
%:
What percentage of children under 18 years living in households, lived with
Grandparents:
Other relatives:
Non-relatives:
Economics and Income
Poverty
What percentage of the population is living below the poverty level?
What percentage of youth age 18 and under are living below the poverty level?
What percentage of youth ages 12-17 are living below the poverty level?
Families: What is the total number of families? What is the number of families living below the poverty level? What percentage of families live below the poverty level?
Comparisons: How do the percentages above compare with the city, state, and national percentages? Do some parts of the study area have higher rates of poverty than others?
Income
What is the median family income in this community?
What is the mean (average) family income in this community?
| 2000 | 2010 | Latest | |
|---|---|---|---|
| Community | |||
| Metropolitan area | |||
| State | |||
| Nation |
Trends
Has the general income of the community changed significantly relative to wider trends? (Middle income to lower income, or gentrification, etc.)
Employment
Major employers or types of employers in the community?
What is the present rate of unemployment? %
Have there been any changes in the type of employment, location of employment, or unemployment rates?
Education
Highest level of education: What percentage of all persons over 25 years old have
Less than high school?
High school?
Bachelor’s degree?
Master’s degree or higher
How do these percentages compare with the national and state percentages?

Example of a graph comparing educational achievements.
What is the current event drop-out rate for any high schools in the community?
Research the elementary and secondary educational institutions in the community.
List and describe each school. Provide any statistical data available.
List any postsecondary educational institutions and their enrollment.

Jeremiah Burke High School
Housing
What are the major housing types in the community based on your observation? (High-rise apartments or public housing; single-family detached houses, rowhouses, duplexes, triple-deckers, etc.)
What percentage of the housing units are owner-occupied? % (Compare to total)
What percentage of the housing units are low-income or affordable? % (Compare to total)
What is the median housing value for the community? For the nation?
Is the housing value increasing, decreasing, or stable?
What are the current typical monthly rental costs for a
Studio:
One-bedroom:
Two-bedroom:
Or more bedrooms
What housing needs and problems does the community have?
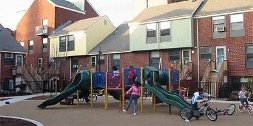

Recreation
List any important recreational facilities and activities in the community:
Source:
Community events
List major community events that occur annually or regularly:
Source:
Organizations
List any major community organizations, neighborhood associations, clubs, social, political, or educational groups:
Source:
Media
How are events in the community publicized?
Is there a community newspaper?
Source:
Social Needs
List any important Social Service Agencies and their services:
Source:
List three social needs that are not being effectively met by these groups.
Source:
What are the major crime concerns in the neighborhood?
Source:
Click here for a template of a community research guide.


